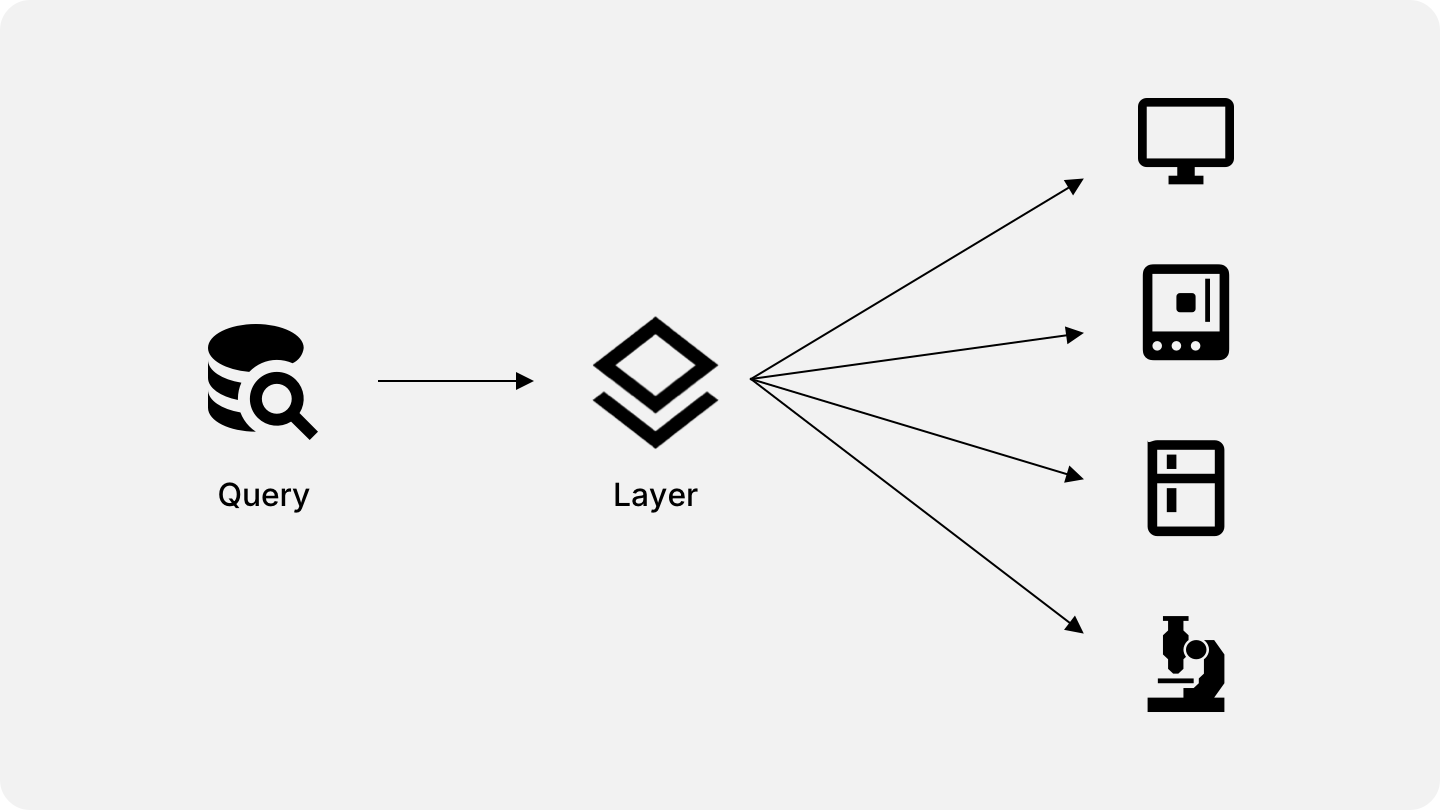
The creation of visual elements is accomplished using layers. Layers reference a pre-saved query and translate each row returned from it to a visual object such as a circle, icon or polygon.
For example, let’s assume the following query result:
| ID | Name | Lat | Long |
|---|---|---|---|
| 1 | Freezer | 36.18307564573561 | -115.1932353660228 |
| 2 | Printer | 36.183310135196216 | -115.19324046463545 |
| 3 | Microscope | 36.183319506460734 | -115.19352366533381 |
| 4 | Centrifuge | 36.183078003060196 | -115.19351330846017 |
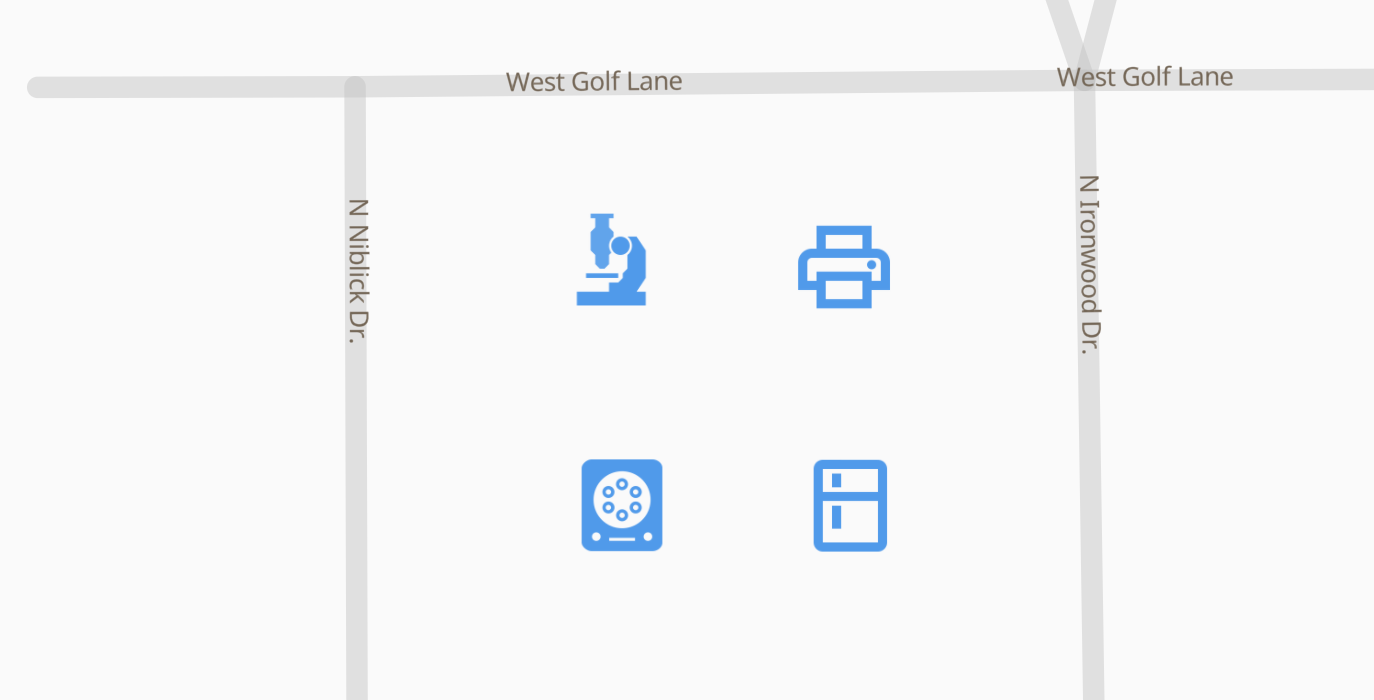
You can create an icon layer configured to this query, bind the icon configuration to the name column and the position configuration to the lat and long columns. Each row returned from the query will be translated to an icon on the screen. The result will be the following:
Layers can also be combined like the example below:
In this example we have four layers attached to the same query. An icon layer translates the asset type column to an icon and a text layer encodes the temperature column to text. Then we have two animated circle layers, one with a pulse animation and another with an external ripple animation.
You can create layers in a visualization by clicking on the top left icon.