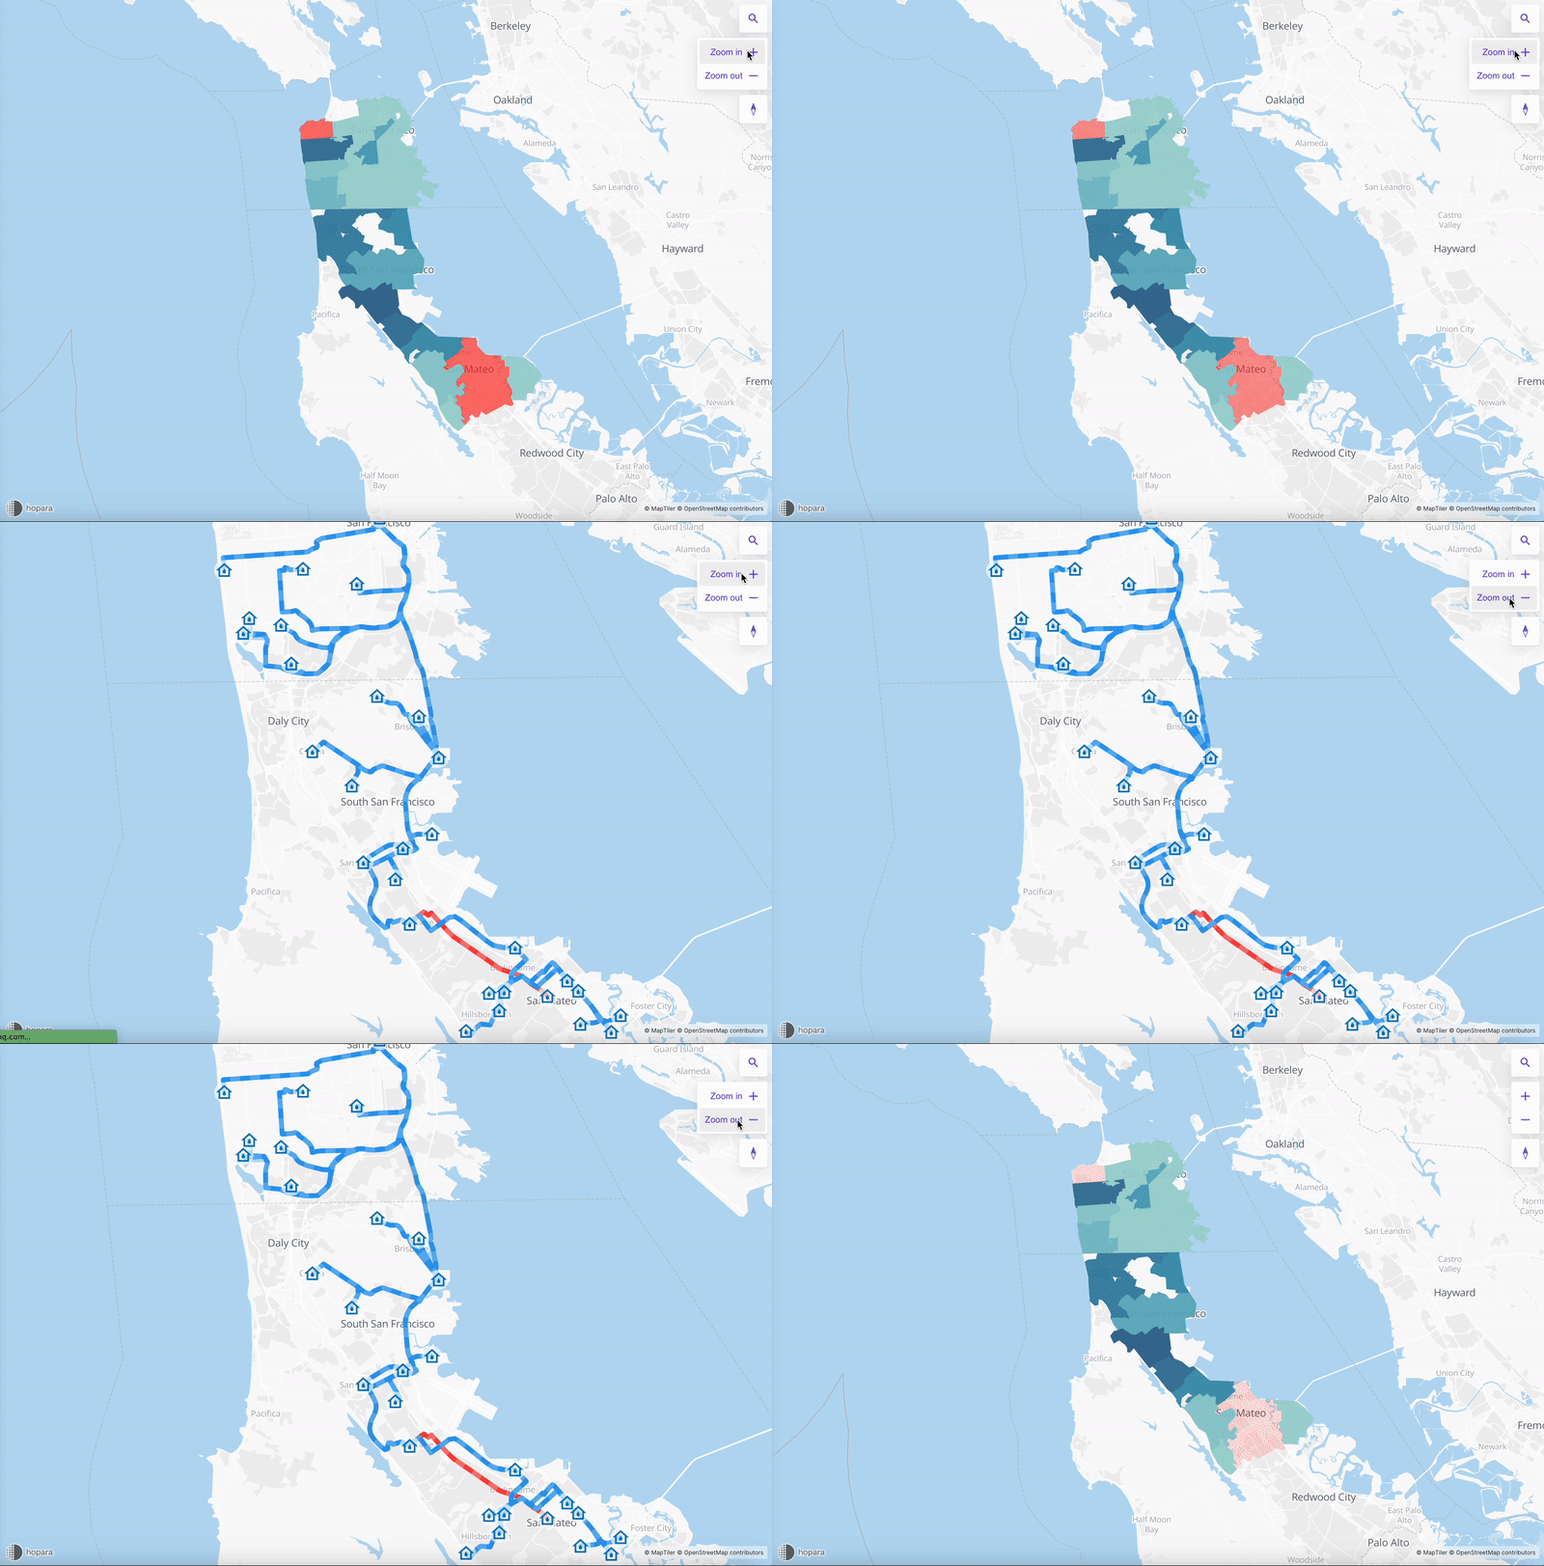
Semantic zoom allows changing the representation of the data as the user zooms in and out, increasing or decreasing details. The goal is to give the most meaningful representation at each zoom level.

There’re two ways of accomplishing semantic zoom in Hopara, by using multiple layers or transforms.
The simplest form of semantic zoom is implemented by using multiple layers where each layer is assigned a different zoom range. The visible property is used to assign a zoom range to a layer.
This strategy usually is applied to change the representation of the data as the user zooms in (e.g. from a polygon showing the regions to lines showing individual pipes).
Transforms take as input the data and the current zoom level and transform the data for visual purposes.
One example of transform is the radius clustering.
By default, a visualization has a zoom range from 0 to 24.
Each zoom level increases the visualization size by a scale of 2 ^ zoom level. For instance, if the visualization has a size of 2x2 at the zoom level 0, it will be 4x4 at zoom level 1 and 8x8 at zoom level 2.